News pages now updated
New for 2022: reclining rattan garden furniture perfect for summer.
You will be pleased to know that news pages on this website have now been updated again. And about time too, I hear you say. Read the News
New Community Forum
We have a community forum which contains items of local interest, and to which you can join and contribute your news and comments
http://uk.groups.yahoo.com/group/Goring-by-Sea/
Once you have filled in the short form to join, you can sign-in for the first time, and thereafter you will go straight to the latest news items. You have options to have just the subject line, or the first three lines, or the whole text. There is advertising (someone has to pay for this!) and you may find it better if you display the forum on your full screen size.
Local Goring by the Sea Landscapes and Natural Environments
If you wish you can decide to have each new news-item sent to you at your Email address. Note that news items are also repeated on this website if you find it easier, and you can still contact us with your comments.
beyond the A27 and Durrington are the South Downs, High Salvington windmill and the stone-age forts at Highdown and Cissbury. |
||
| To the West is the village of Ferring, and then the towns of Littlehampton and Bognor, with the Butlins Skyline Pavilion glinting in the sun. |
 |
To the East is Worthing and beyond that the harbour at Shoreham and the resort of Brighton. |
with views, on a good day, to the Isle of Wight (40 miles), Selsey Bill (20 miles), the white cliffs of the Seven Sisters and Beachy Head (30 miles) |
||
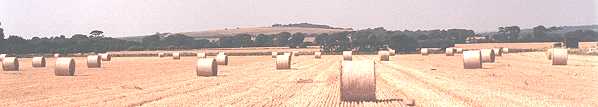
Goring has record sunshine each year, and the area is well known for the acres of greenhouses where bedding plants are grown, it seems, for much of southern England.
Between Goring and Ferring is an expanse of trees and green fields called the Goring Gap, a strategic separation to hold back the tide of houses, fiercely protected by the Goring Gap Preservation Trust.
The mile-long Ilex Avenue runs from Goring church to Ferring, glorious, evergreen holm oaks, the finest planting of such trees in England. And from the avenue down to the sea are three more avenues of trees, down Sea Lane Goring, down Sea Lane Ferring, and down The Plantation where only walkers are welcome
And to the North is Highdown with gardens, and a short walk to the Saxon Fort on top of the hill, and a cafe for a cuppa before you go home.
There are no hotels, no slot machines, no candyfloss. Just a row of beach huts, and three excellent cafes. Fishing boats are hauled up above the high water mark. The beach is good for swimming around the high tide, and excellent for sailing, jet-skis, and at low tide for horses galloping in the surf. A wide expanse of neatly mown grass attracts school and church outings on summer weekends, flyers of kites, and dog walkers every day, rain or shine.
 |